
Mild winter weather may lead to persistently high natural gas inventories through 2025
Data source: U.S. Energy Information Administration, Short-Term Energy Outlook (STEO), April 2024
Data values: U.S. Natural Gas Supply, Consumption, and Inventories
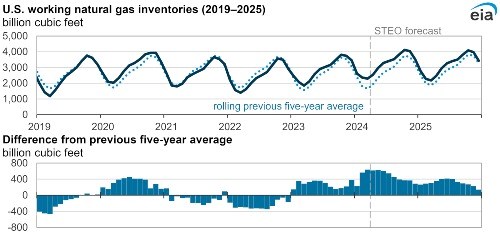
U.S. working natural gas inventories ended the winter heating season (November 1–March 31) at 2,290 billion cubic feet (Bcf), 39% more than the previous five-year (2019–23) average. Relatively high natural gas inventories all winter have contributed to record-low Henry Hub natural gas spot prices. The surplus to the five-year average grew over winter 2023–24 because of mild weather, low natural gas consumption, and high natural gas production. In our April Short-Term Energy Outlook (STEO), we expect natural gas inventories to remain relatively high and natural gas spot prices to remain relatively low through 2025.
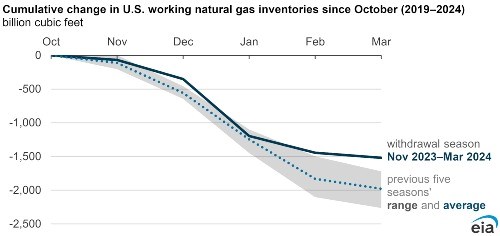
According to the National Oceanic and Atmospheric Administration (NOAA), the United States just experienced its warmest winter on record. Since October 2023, the residential and commercial sectors consumed less natural gas than during previous winters, and less natural gas was withdrawn from storage: about 1,500 Bcf this winter versus 2,000 Bcf in previous winters.
Data source: U.S. Energy Information Administration, Natural Gas Monthly and Weekly Natural Gas Storage Report
Data values: Underground Natural Gas Storage by All Operators and Working Gas in Underground Storage
Note: February and March 2024 values are interpolated from weekly data.
Mild winter weather led to low residential and commercial sector use of natural gas
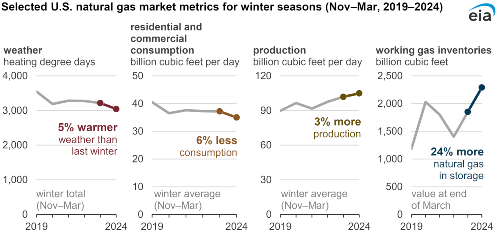
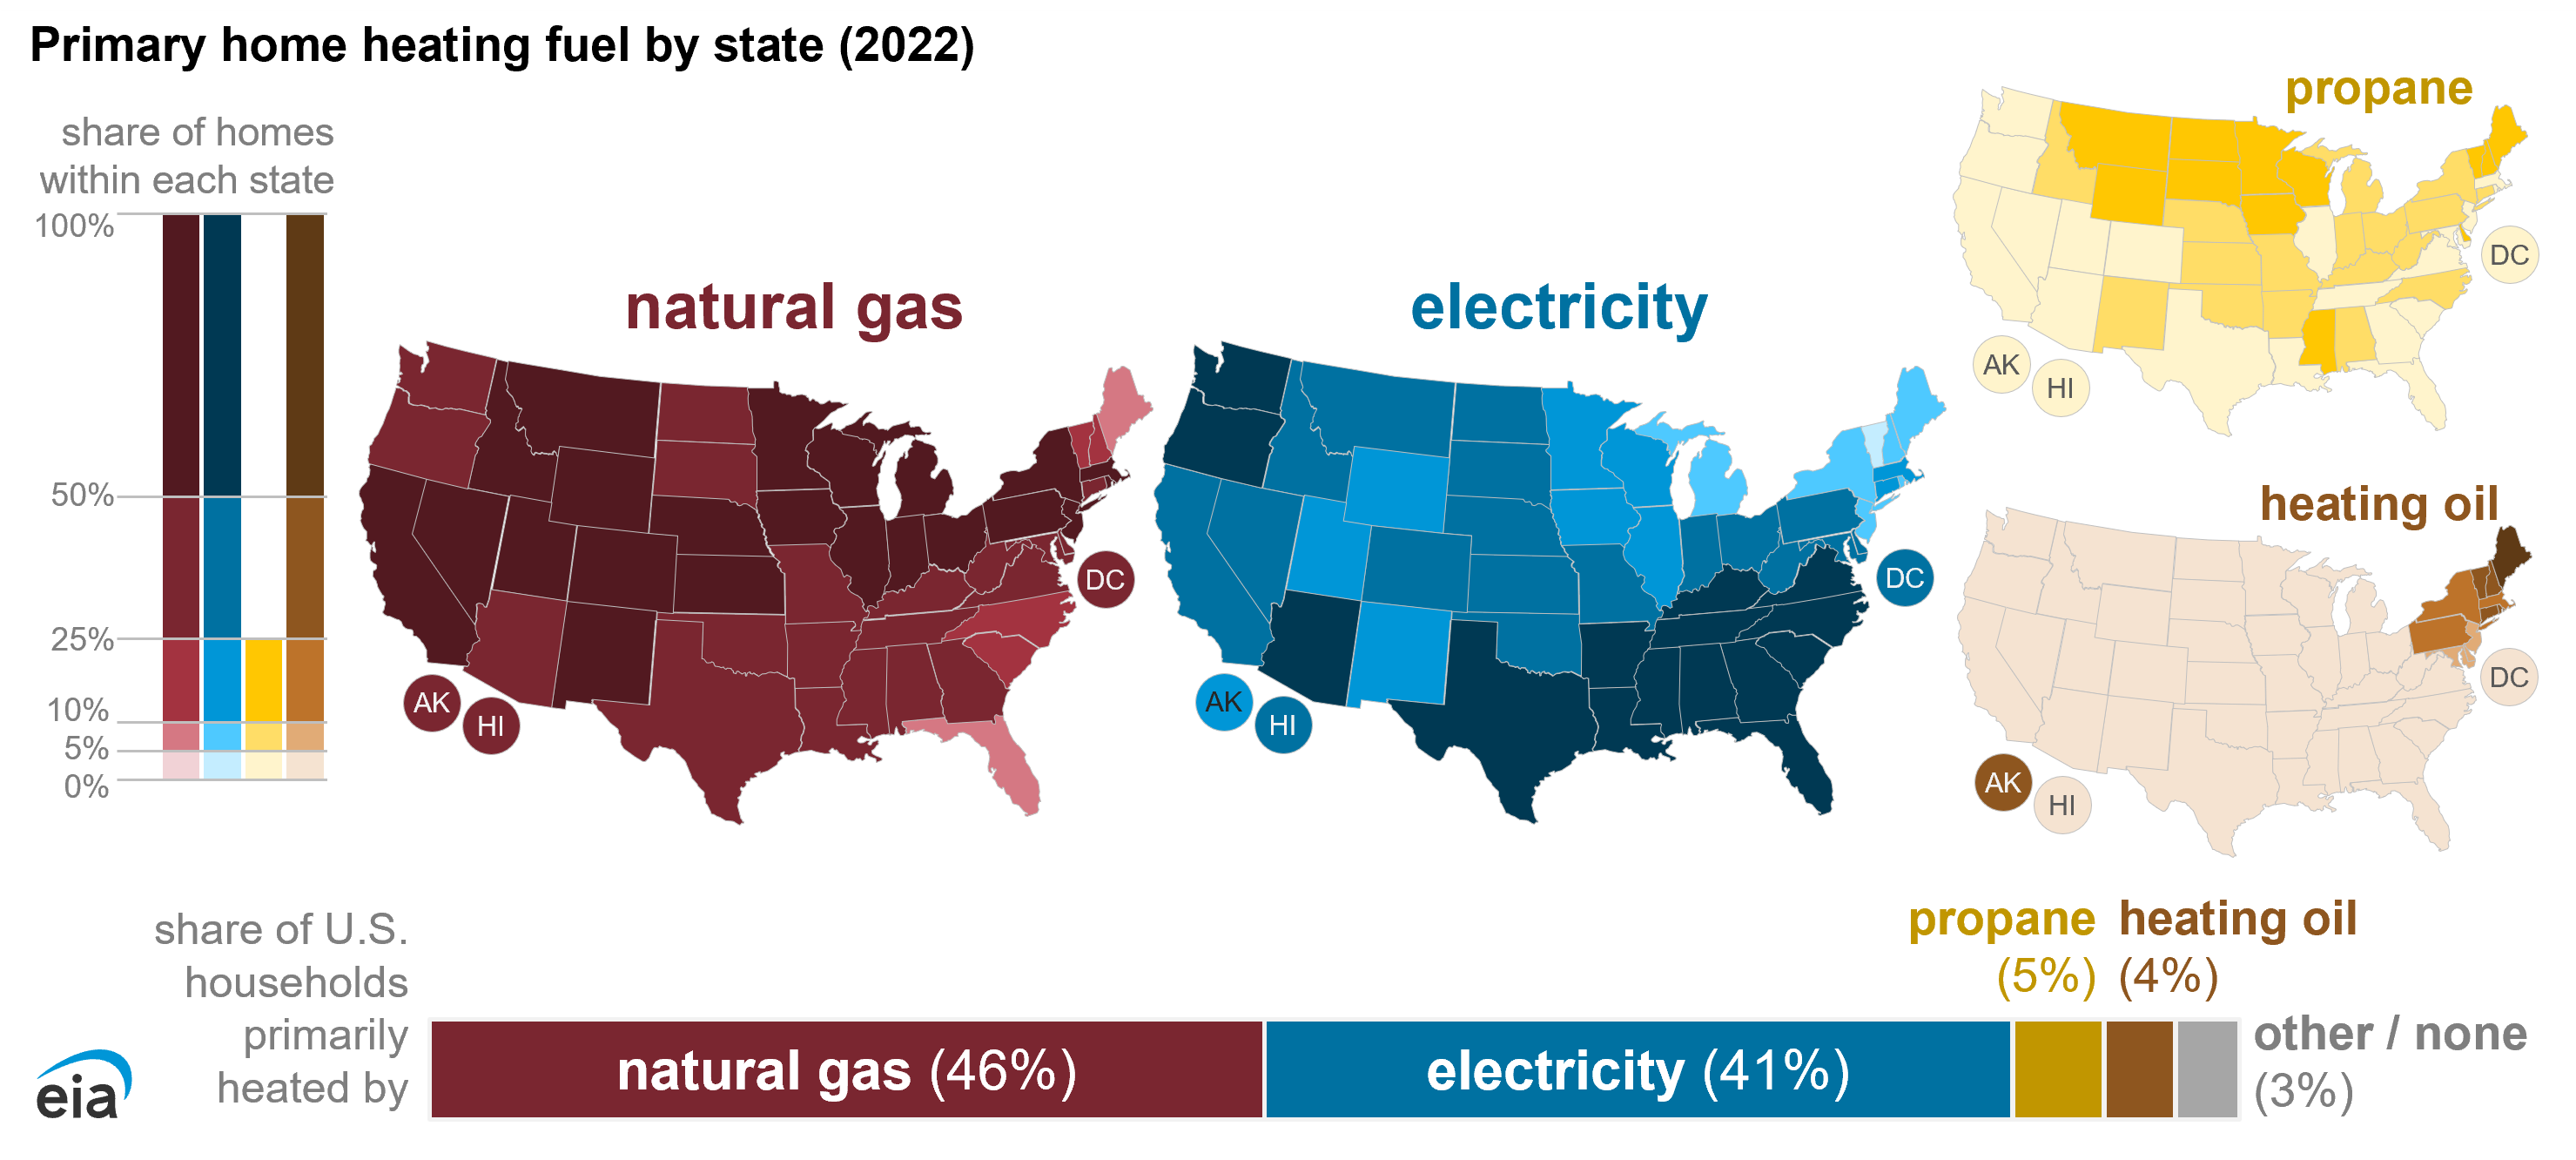
U.S. natural gas consumption peaks in winter because of its use as a space-heating fuel in the residential and commercial sectors. According to NOAA, December 2023 was the warmest December on record in many U.S. locations, particularly in the northern and central United States, where most households use natural gas for space heating. In the Northeast and Midwest, natural gas consumption in the residential and commercial sectors in December 2023 averaged 20 billion cubic feet per day (Bcf/d), 23% lower than December 2022 and 15% lower than the previous five-year (2018–22) average.
Except for a winter storm in mid-January, relatively mild weather from November 2023 through March 2024 resulted in natural gas consumption in the U.S. residential and commercial sectors averaging 35 Bcf/d, 6% less than in the winter of 2022–23 and 7% less than the previous five-year average. Less consumption this winter contributed to below-average natural gas storage withdrawals and higher natural gas inventories.
Data source: U.S. Energy Information Administration, Short-Term Energy Outlook (STEO), April 2024
Data values: U.S. Natural Gas Supply, Consumption, and Inventories
Natural gas production increased this winter
Dry natural gas production averaged 106 Bcf/d in November and 107 Bcf/d in December—a record high. More production has also contributed to relatively high natural gas volumes in storage and the resulting low prices. In February and March, several producers, reacting to low natural gas prices, announced current or planned curtailments to production or reductions in capital expenditures toward natural gas-directed activities in 2024.
We estimate that natural gas production averaged 103 Bcf/d in March, or 4 Bcf/d lower than the December 2023 peak. If production falls faster than we currently forecast and natural gas consumption—especially in the electric power sector—increases more than we currently forecast (for example, because of unusually hot weather this summer), then inventories could be drawn down to average levels and natural gas prices could rise.
Natural gas inventories influence natural gas prices
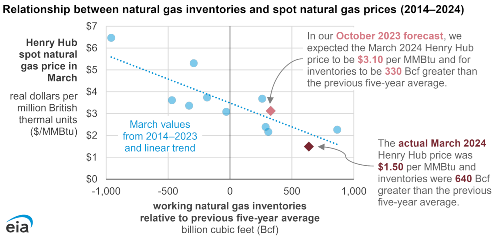
The difference between the storage inventory level at the end of March and the previous five-year average is an important price indicator for market participants at the start of natural gas storage injection season (April 1–October 31). The higher the surplus to the previous five-year average, the lower the Henry Hub price tends to be, and vice versa.
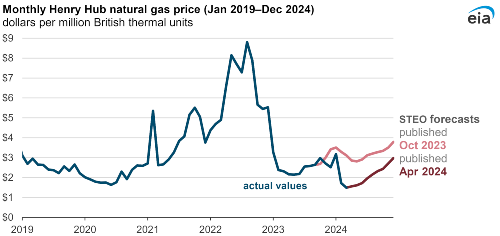
In our October 2023 STEO, we forecast U.S. working natural gas inventories would end the winter 330 Bcf more than the previous five-year average and the Henry Hub spot price would average $3.10 per million British thermal units (MMBtu). As the winter progressed, the surplus of natural gas inventories continued to build because consumers needed less natural gas for heating. By the end of March, inventories were 640 Bcf higher than the previous five-year average, and the Henry Hub price had fallen to $1.50/MMBtu, generally in line with the relationship between inventories and price.
Data source: U.S. Energy Information Administration, Short-Term Energy Outlook (STEO), October 2023 and April 2024
Data values: U.S. Natural Gas Supply, Consumption, and Inventories and STEO Archives
We changed our forecast for natural gas prices for the remainer of 2024 based on the recent record-low Henry Hub spot price and the persistently high natural gas inventories. In the October STEO, we forecast the Henry Hub spot price to average $3.20/MMBtu in 2024. We now forecast the Henry Hub price to remain below $2.00/MMBtu until the second half of 2024 and to average $2.20/MMBtu for the year. We still expect the natural gas price to increase from the March 2024 low as production curtailments and increased natural gas consumption for electricity generation bring supply and demand closer to balance.
Data source: U.S. Energy Information Administration, Short-Term Energy Outlook (STEO), October 2023 and April 2024
Data values: U.S. Natural Gas Supply, Consumption, and Inventories and STEO Archives
Related News
Related News

- Cheniere signs deal with Bechtel to expand U.S. LNG export capacity
- TC Energy approves $1.5-B Columbia Gas expansion after profit tops estimates
- Baker Hughes’ fuel flexible NovaLT™ 16 gas turbine certified by RINA for marine propulsion
- Commonwealth LNG FID attracts global syndicate of leading banks
- Dozens injured, 18 missing after blast during restart at giant Qatar LNG site

Comments