
Global Project Data
3/1/2020
Hydrocarbon Processing’s Construction Boxscore Database and Gulf Energy Information’s Energy Web Atlas are tracking nearly 400 active gas processing/LNG projects around the world. As shown on the map below, Asia-Pacific is the leader in total active projects globally, followed by the U.S. Most capital expenditures in the Asia-Pacific region are for LNG import terminals in China and India. Both countries are investing heavily in new natural gas infrastructure to fuel power generation demand. Several other nations—Indonesia, Japan, Malaysia and Thailand—are also investing in new LNG import infrastructure. These investments are imperative to meeting future power generation demand. GP
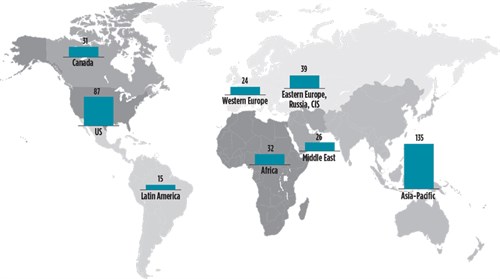 |
| Total active gas processing/LNG projects by region Source: Energy Web Atlas |
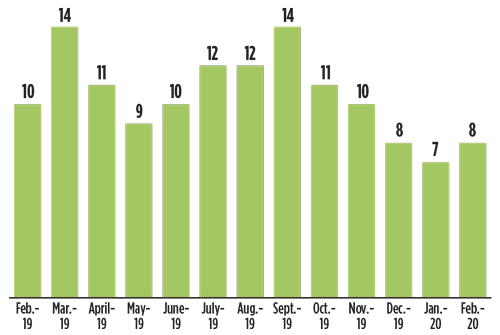 |
| New gas processing/LNG project announcements, February 2019–February 2020 |
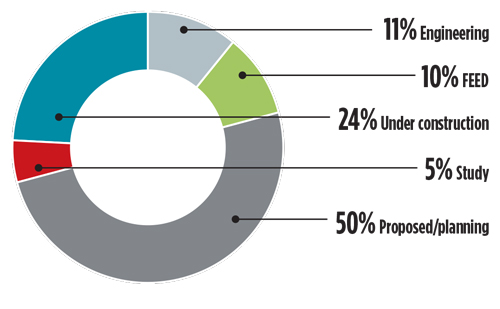 |
| Active gas processing/LNG market share by status level |


Comments