
Software development for designing gas adsorption processes
M. S. ALIVAND, M. FAGHIHI and S. MIRIAN, Nitel Pars Co. (Fateh Group), Tehran, Iran;
and S. SADIGHI, Research Institute of Petroleum Industry, Catalysis Research Division, Tehran, Iran
Adsorption in the oil, gas and petrochemical industries is used for separation and purification of different gas and liquid streams. However, the lack of a suitable design process for adsorption columns remains an engineering challenge. Some scientific references offer rules of thumb for designing cyclic adsorption columns, but a reliable procedure based on exact correlations (i.e., one based on the extraction of experimental data and computational fluid dynamics simulations) has been implemented by only a few companies.
The development of software to calculate vessel specifications (i.e., bed dimensions, vessel and cap traits, and adsorbent weight) and process definitions (i.e., bed configuration, regeneration flowrate, allowable superficial velocity, pressure drop, time of adsorption, heating, cooling and standby) is needed.
Toward this end, Manning and Thompson1 developed a new method for the regeneration process, proving that the correlation can be used successfully with high precision. Kohl and Nielsen2 investigated the mechanism of adsorption and pressure drop correlations for different types of adsorbents (bead and pellet), based on experimental studies. Kidnay and Parrish3 studied different adsorption processes and suitable regeneration conditions. Kidnay and Parrish also studied phenomena that can affect the adsorption process, including inlet and regeneration gas specifications, regeneration flow direction, cooling ramp-up and carbonyl sulfide (COS) formation.
Furthermore, Mokhatab and Poe4 gathered the first complete procedures for adsorption vessel design and investigated the effects of design parameters on different facets of the adsorption cycle. Stewart and Arnold5 proposed new methods for estimating the maximum allowable superficial velocity to calculate bed dimension and optimum operating conditions. Stewart and Arnold also improved upon earlier design procedures.
In this work, a professional, in-house software program for designing adsorption processes in gas services is introduced. Using this adsorption design software (ADS), the feasibility, reliability, energy consumption and initial investment cost of each design can be analyzed. Moreover, the ADS can be used to predict optimized design parameters and analyze experimental data. It is reliable for a variety of gas services, including dehydration, desulfurization, mercaptan and mercury removal, and others.
Three case studies are presented for evaluating the software. In these studies, data gathered from commercial units are compared with the ADS results. Based on these comparisons, the software suggests new and modified values for the adsorption bed dimensions and regeneration conditions to save energy, increase the lifetime of the beds and adsorbents, reduce capital costs and optimize operating variables, such as superficial velocity and pressure drop. The ADS can also be used in design projects to improve the efficiency of the adsorption process and to optimize process variables after changing the adsorbent type.
ADS design procedure. The design of the adsorption bed is carried out in 10 steps, as detailed in the following sections.
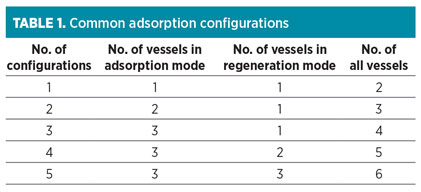
Step 1: Select bed configuration. Adsorption is a cyclic process, and both adsorption and regeneration cycles are performed in the vessels during the operation. Therefore, different configurations exist for different adsorption beds. These configurations can be related to various aspects, such as design calculation, economic constrains and energy consumption. Common configuration types are presented in Table 1.
 |
Step 2: Select the cycle time. Different cycle times can be selected for adsorption operation. However, periods of 8 hr, 12 hr, 16 hr, 18 hr, 20 hr, 22 hr and 24 hr are most common in industrial units (particularly 8 hr–12 hr). Longer adsorption periods lead to higher adsorption volumes and higher capital cost, and result in lower energy consumption at the regeneration step and longer adsorbent cycle lifetime.6
Step 3: Estimate dynamic adsorption capacity (DAC). DAC is one of the most important factors to be correctly estimated in any design procedure. It is defined as the proportion of adsorbed impurity weight to adsorbent weight. The DAC value is dependent on the adsorbent type and the impurity and quality of manufactured adsorbents. The type of adsorbent can be chosen based on the specifications for inlet and outlet gases, operating temperature (T), economy, lifetime and the amount of non-reclaimable components.
Usually, DAC is reported at 25°C and 100% relative humidity (RH). If the adsorption conditions change, then relevant correlations should be used to determine DAC at the desired conditions. This factor is calculated as shown in Eqs. 1–3:
SCF = 0.0834 Ln × (Saturation %) + 0.6316 (1)
Saturation < 80%
TCF = –0.0047 T(C) + 1.1109 T > 25°C (2)
DAC = SCF × TCF × DAC(25°C, Saturation = 100%) (3)
In Eqs. 1–3, SCF and TCF are saturation and temperature correction factors, respectively. DAC may be reduced to 30%–40% during 3 yr–5 yr of operation.3 The drop of this factor depends mainly on parameters such as adsorbent type, adsorption and regeneration temperature, RH of feed and specifications of the regeneration gas.2 DAC loss is very high at the initial cycles and would be constant at the final cycles. Moreover, impurities such as amines, glycols and heavy hydrocarbons reduce DAC values, since regeneration cannot be carried out for these elements.7
Step 4: Determine maximum allowable superficial velocity. This step is the first and main part of the calculation for specifying the dimension of an adsorption column. Usually, designers try to keep the superficial velocity at the maximum allowable value at a constant flowrate. Higher superficial velocity leads to higher adsorption capacity, higher cycle time, lower mass transfer resistance, lower mass transfer zone and higher heat transfer rate.
For higher superficial velocity, higher column height is needed to compensate for the lack of contact time through the vessel. This parameter can be calculated as shown in Eq. 4:
(4)
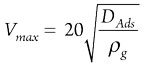
where:
- Vmax = Maximum allowable superficial velocity
- DAds = adsorbent diameter
- ρg = Gas density.
The latter strongly depends on pressure and temperature.
Step 5: Determine column diameter. After calculating the maximum allowable superficial velocity, it is possible to define the corresponding minimum column diameter, which can be considered as an appropriate initial guess,3,6 as shown in Eq. 5:
(5)
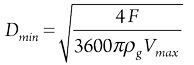
where:
- Dmin = Minimum allowable vessel diameter
- F = Mass flowrate of gas.
Step 6: Calculate bed height. The bed height can be calculated as shown in Eq. 6:
(6)
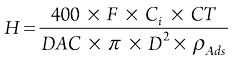
H = Vessel heightwhere:
- Ci = Impurity concentration
- CT = Cycle time
- ρAds = Adsorbent density
- D = Vessel diameter.
Step 7: Calculate pressure drop. Pressure drop throughout the adsorption vessel can be calculated by using the Ergun equation, shown in Eq. 7:
(7)
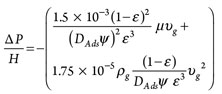
where:
∆P = Pressure dropwhere:
µ = Viscosity of gas stream
υg = Superficial velocity of the gas stream
ε = Void fraction throughout the vessel
ψ = Shape factor.
For the bead-shaped adsorbents, the latter is equal to 1.
Step 8: Check dimensions and conditions. After calculating the bed dimensions, four criteria should be checked according to the values presented in Table 2. Usually, the ratio of height to diameter (H:D) of the vessel, which is related to the lower diameter or lower cycle time, should not exceed 5. According to Eq. 7, if the superficial velocity increases, then the total pressure drop also increases. However, it is possible that superficial velocity is in the acceptable range and that pressure is higher than expected, or vice versa; therefore, each of these parameters should be adjusted individually.
 |
If one or more of the variables presented in Table 2 are not within the acceptable range, then the following steps should be taken:
- Go back to Step 5 of the ADS design procedure and decrease the superficial velocity, and then recalculate the remaining steps.
- Go back to Step 2 of the ADS design procedure and decrease the cycle time, and then recalculate the remaining steps. This correction can be useful when superficial velocity is acceptable, and when pressure drop and H:D are rejected.
- Go back to Step 1 of the ADS design procedure and reduce the number of adsorption beds without changing the regeneration bed number (except for configurations No. 4 and No. 5). Then, justify the superficial velocity throughout the vessel.
Using the proposed approaches, various options can be considered with different cycle times and bed configurations. Here, the selection of the best case should be made by the engineers considering optimum conditions, such as available space, energy consumption and capital cost.
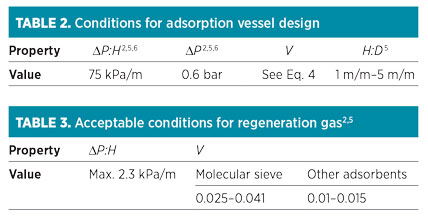
Step 9: Calculate vessel properties. The related correlations for the calculation of thickness and weight of the vessel are shown in Eqs. 8–10. The corrosion allowance (CA) for the vessel is usually considered between 2 mm and 3 mm, according to the vessel material, operating pressure and temperature, and the presence of different corrosive ingredients in the gas stream.
Wall thickness Weight
Shell: ![]() πDaveHTKρv (8)
πDaveHTKρv (8)
2:1 elliptical head: 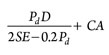 1.084Dave2TKρv (9)
Hemispherical head: ![]() 1.57Dave2TKρv (10)
1.57Dave2TKρv (10)
Note: ![]()
Where:
Pd = Design pressure is 10% more than the maximum operating pressure
E = Joint efficiency, equal to 0.85 for the spot examined and 1 for 100% X-ray joints
S = Allowable stress, equal to 1,300 bar for typical carbon steel plates
TK = Vessel thickness.
Step 10: Calculation of regeneration. The regeneration calculations of the ADS can be used for temperature swing adsorption (TSA). The required time for the regeneration is the sum of the heating and cooling times. Prior to calculating the time and flowrate of regeneration, the required heat should be estimated. The required heat is the sum of the heating to desorb impurities (Qimp), heating of the adsorbent (Qads), and heating of the vessel (Qves). All mentioned variables during intermediate heating are estimated using Eqs. 11–13, and all variables during top heating are estimated using Eqs. 14–16:
Qimp = mimpCp,imp (Tfh – Tin) (11)
Qads = madsCp,ads (Tfh – Tin) (12)
Qves = mvesCp,ves (Tfh – Tin) (13)
Qimp = mimpCp,imp (Tth – Tfn) (14)
Qads = madsCp,ads (Tth – Tfn) (15)
Qves = mvesCp,ves (Tth – Tfn) (16)
Moreover, heat of desorption (Qdes) for adsorbed impurities can be calculated as shown in Eq. 17:
Qdes = mimp∆Hdes (17)
where:
- Tin = Inlet heating temperature
- Tfh = First heating temperature
- Tth = Top heating temperature
- ∆Hdes = Energy required for desorbing impurities considered equal to the latent heat of impurity
- Qdes = Required heat for desorption of impurities.
In commercial units, the adsorption column is usually insulated; however, 10% of total required heat for regeneration is considered as heating loss. The regeneration heat (Qcalc) is calculated as shown in Eq. 18:
Qcalc = (Qimp + Qdes + Qads + Qves) × 1.1 (18)
In real cases, the actual regeneration heat (Qact) is more than Qcalc, due to the difference between the inlet and outlet regeneration gas temperatures (Fig. 1).
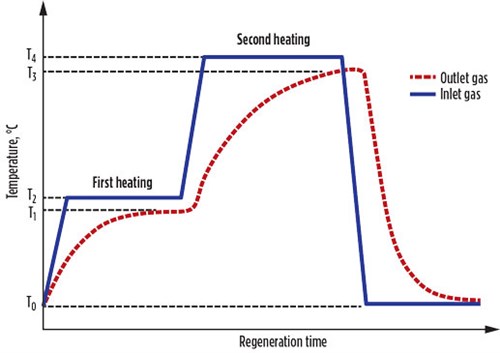 |
|
FIG. 1. Temperature variations during the regeneration step. |
The Qact values for the first and second heating steps are calculated using Eqs. 19 and 20, respectively:
(19)
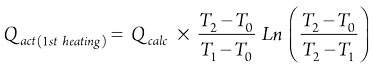
(20)
In the cooling step, the heat is required only for adsorbents and vessels, and the regeneration time is estimated using heating and cooling heats and the flowrate of the regeneration gas. Furthermore, defined constraints of pressure drop and velocity should be checked according to the values presented in Table 3.
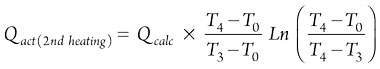
Software development. Designing an adsorption process requires trial and error, which is time-consuming. The ADS is programmed to find the optimum design for an adsorption column. The software has a variety of options, including various cycle times and bed configurations. The implementation of the ADS is accomplished by coding Eqs. 1–20 into the MATLAB software program developed by MathWorks, and then following the flowchart in Fig. 2.
 |
|
FIG. 2. Algorithm used for adsorption design. |
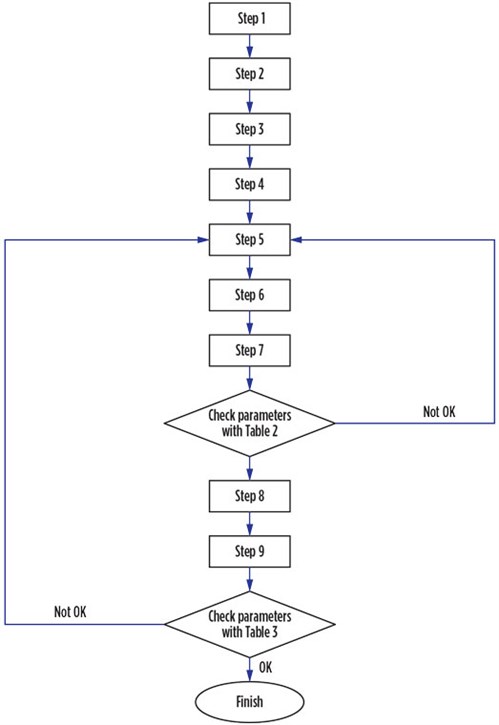
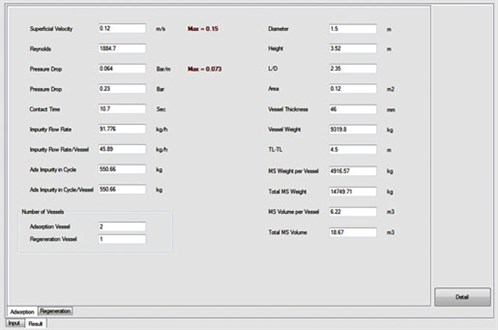
Fig. 3 presents the graphical user interface (GUI) and input data sheet for the ADS. Based on the described methodology, the ADS introduces different configurations and cycle times in which regeneration flowrate, superficial velocity and pressure drop are estimated at their optimum values.
 |
|
FIG. 3. Input data sheet for the ADS. |
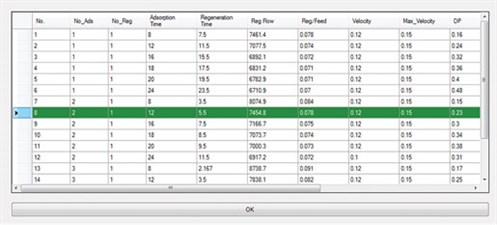
Furthermore, the ADS uses its database to compare the proposed designs with actual or commercial cases. The user can select the regeneration step with or without intermediate heating, and also adjust the ramp-up for the heating and cooling steps. One of the main advantages of the ADS is that the user can view all of the specific calculations for different parts (e.g., heat calculations); therefore, all results can be compared and the best option can be chosen based on the situation and restrictions. Fig. 4 shows an output data sheet from the ADS results after the corresponding calculations were performed, and Fig. 5 shows the optimum designs reported by the ADS.
 |
|
FIG. 4. Output page from the ADS results. |
 |
|
FIG. 5. Optimum designs reported by the ADS. |
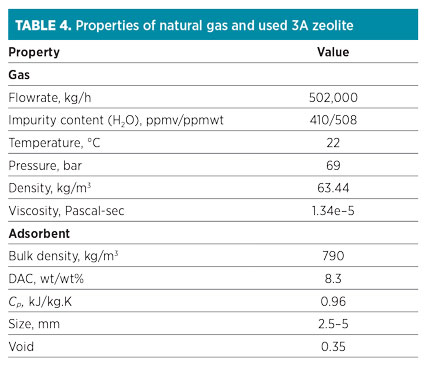
Case Study 1: Natural gas dehydration. The gas dehydration plant in this study is installed before the NGL fractionation unit. The presence of a negligible amount of water (i.e., more than 0.1 ppmv) at the gas stream leads to hydrate formation and cold box blockage. A 3A molecular sieve is used to successfully prevent CO2 and H2S accumulation at closed-loop cycles.
A regeneration process is performed with intermediate and top heating. The regeneration temperature for 3A molecular sieves is normally lower than the typical regeneration temperature. In this case, intermediate heating (first level) and top heating (second level) are performed at 120°C and 230°C, respectively. The properties of natural gas and used molecular sieves are listed in Table 4.
 |
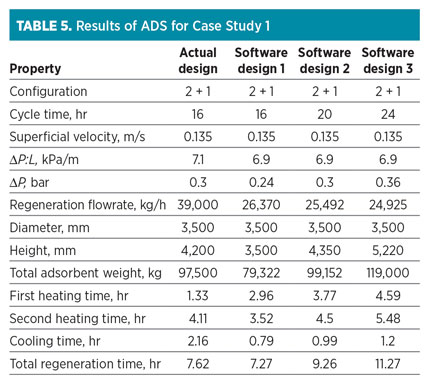 |
The data presented in Table 4 are introduced on the input variable sheet of the ADS. Results obtained from the software are shown in Table 5. Note: According to closed-loop design, 7.5% of the feed stream is recycled to the inlet feed gas flowrate (540,000 kg/hr).
Table 5 shows three scenarios recommended by the ADS. The comparison between “Actual design” and the first scenario (“Software design 1”) shows that the ADS proposes the same vessel diameter as the optimum choice, but the column height is different due to 20% over-design for the inventory of zeolite adsorbent.
The ADS also calculates a lower regeneration flow than the actual scenario. In this case, which requires the prevention of reflux, both heating stages are accomplished with low ramp-up; therefore, to finish the regeneration process at a specific time, a higher regeneration flowrate should be used.
Case Study 2: Hydrogen purification. The main duty of the adsorption system in this refinery case is the purification of the H2 stream before it enters the catalytic reactor. The presence of water can create accelerated deactivation for the molecular sieve; therefore, this unit was designed with a 4A molecular sieve as an adsorbent to remove water and small amounts of CO2 and H2S.
This adsorption system operates in an open-loop mode, making regeneration feasible at lower pressure (8.8 bar). The regeneration process includes a heating stage at 300°C. Specifications for the natural gas feed and loaded molecular sieve are listed in Table 6. The data are used as the input variables for the ADS, and results obtained from the software are shown in Table 7.
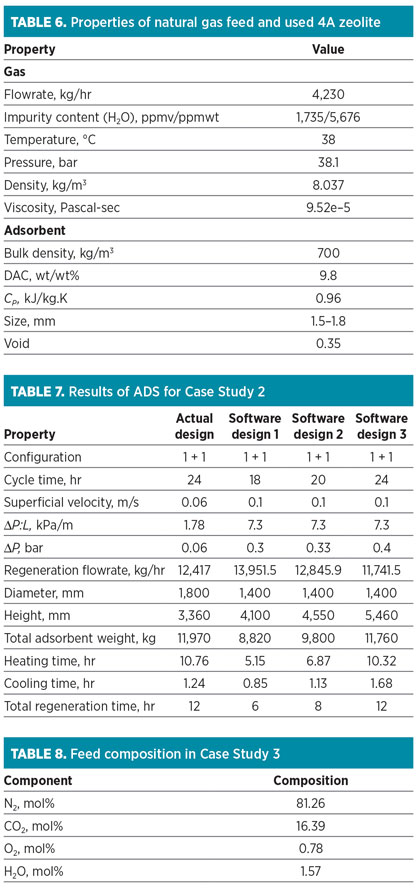 |
In Table 7, three recommended scenarios by the ADS are represented. “Software design 3” has a 24-hr cycle time, similar to the actual design. The ADS proposes the use of a vessel with a diameter of 1.4 m, while the actual design is a vessel with a diameter of 1.8 m. The ADS shows that the adsorption operation with the higher superficial velocity is allowable; therefore, the regeneration flowrate and total amount of adsorbent can be decreased to 5.44% and 1.75%, respectively.
Case Study 3: Nitrogen dehydration. At this service, the feed stream consists of mainly nitrogen (Table 8). The significant impurity is water, which should be removed at a moderate level (maximum 50 ppmv). CO2 should be partially removed. Activated alumina is applied according to the feed specifications (high water concentration) and product requirements (no deep dehydration). The specifications of feed and loaded activated alumina are represented in Table 9.
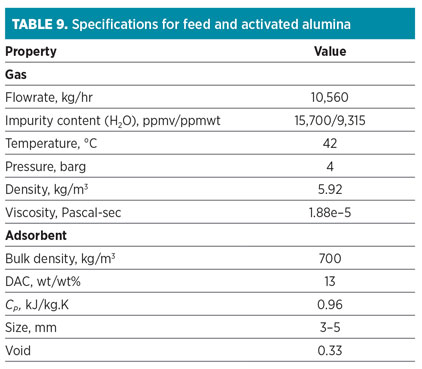 |
One of the main advantages of this adsorbent is its low energy consumption in comparison to different types of zeolites (i.e., top heating is accomplished with 205°C and a lower regeneration flowrate). In this case, regeneration flow is part of the feed flowrate with the same composition. At the end of the cooling step, impurities are partially adsorbed, and they should be included in calculations. The regeneration is then carried out by both intermediate heating and top heating at 120°C and 205°C, respectively.
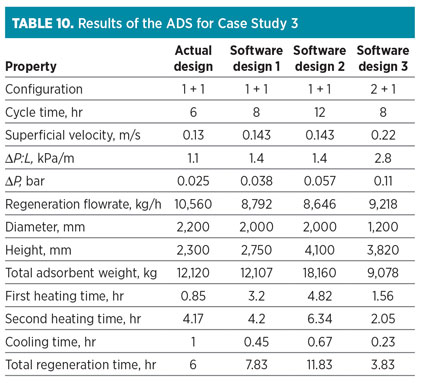 |
The data in Table 8 are used as input variables for the ADS. Outputs are shown in Table 10. The results show that the actual cycle time is 6 hr, but the minimum cycle time reported by the ADS is 8 hr. Due to the lower reported cycle time, the energy consumption of TSA service is high, and it is rejected. According to the results for “Software design 1” in Table 10, the ADS proposes that the 2-m-diameter adsorption column has a higher superficial velocity of up to 110%, which leads to the higher pressure drop. Additionally, both the regeneration flowrate and the adsorbent inventory decrease considerably due to the increase in superficial velocity.
Takeaway. In this study, a software for designing adsorption columns is presented. The ADS can be used to design various adsorption processes, such as dehydration, desulfurization, mercaptan removal, mercury removal and other services.
Case studies show that the ADS can be successfully applied for the optimization of energy, capital costs and operating conditions for an adsorption column. GP
Nomenclature
∆Hdes Required energy for desorption, kJ/kg
∆P Pressure drop, bar
CA Corrosion allowance, m
Ci Impurity concentration, ppmwt
Cp Specific heat of inlet gas, J/kg.K
Cp,imp Specific heat of impurities, J/kg.K
Cp,ads Specific heat of adsorbent, J/kg.K
Cp,ves Specific heat of vessel, J/kg.K
CT Cycle time, hr
D Vessel diameter, m
DAds Adsorbent diameter, m
Dmin Minimum vessel diameter, m
Dave Average diameter of vessel, m
E Joint efficiency
F Mass flowrate, kg/hr
H Vessel height, m
P Operating pressure, bar
Pd Design pressure, bar
Qdes Heat of desorption, kJ
Qimp Heat of impurities, kJ
Qads Heat of adsorbents, kJ
Qves Heat of vessel, kJ
Qact Actual regeneration heat, kJ
Qcalc Calculated heat for regeneration, kJ
mimp Mass of impurities, kg
mads Mass of adsorbents, kg
mves Mass of vessel, kg
S Allowable stress, bar
T Operating temperature, °C
Tfh First heating temperature, °C
Tth Top heating temperature, °C
Tin Inlet temperature, °C
TK Vessel or head thickness, m
Vmax Maximum allowable superficial velocity, m/s
ρAds Density of adsorbent, kg/m3
ρg Density of gas, kg/m3
ε Void fraction throughout the vessel
μ Gas viscosity, Pascal-sec
ψ Shape factor of adsorbent
DAC Dynamic adsorption capacity
TCF Temperature correction factor
SCF Saturation correction factor
Dave Average vessel diameter, m
Din Internal vessel diameter, m
Dout Outside vessel diameter, m
Literature cited
- Manning, F. S. and R. E. Thompson, Oilfield Processing of Petroleum: Crude Oil, Vol. 1, PennWell Books, Houston, Texas, 1995.
- Kohl, A. and R. Nielsen, Gas Purification, 5th Ed., Gulf Professional Publishing, Houston, Texas, 1997.
- Kidnay, A. J. and W. H. Parrish, Fundamentals of Natural Gas Processing, Taylor and Francis, Abingdon, UK, 2006.
- Mokhatab, S. and W. A. Poe, Handbook of Natural Gas Transmission and Processing, Gulf Professional Publishing, Burlington, Massachusetts, 2006.
- Stewart, M. and K. Arnold, Gas Dehydration Field Manual, Gulf Professional Publishing, Elsevier, Burlington, Massachusetts, 2011.
- Gas Processors Suppliers Association (GPSA), Engineering Data Book, 12th Ed., Tulsa, Oklahoma, 2004.
- Campbell, J. M., Gas Conditioning and Processing, Vol. 2, 7th Ed., PennWell Corp., Tulsa, Oklahoma, 1992.
 |
Masood Sheikh Alivand is a Simulation Expert and Process Engineering Specialist at Nitel Pars Co. in Tehran, Iran, where he has been working since September 2014. Mr. Alivand holds
a BSc degree in chemical engineering from Amirkabir University of Technology (Tehran Polytechnic) and an MSc degree in chemical engineering from Sharif University of Technology in Tehran.
 |
Morteza Faghihi works at Nitel Pars Co. in Tehran, Iran. He holds a BE degree in chemical engineering from Shiraz University. He also holds an MS degree and a PhD in chemical engineering (polymers) from Sharif University of Technology in Tehran, Iran. During his studies, he performed four research projects in the chemical engineering field and published
several scientific papers.
 |
Sadjad Mirian is a Process Engineering Specialist at Nitel Pars Co. in Tehran, Iran, with more than 9 yr of experience in oil, gas and petrochemicals. He holds an MS degree in chemical engineering from the University of Sistan and Baluchestan in Zahedan, Iran. He has published several papers in national and international journals and at conferences.
 |
Sepehr Sadighi is an Assistant Professor in the Catalysis Research Division of the Research Institute of Petroleum Industry in Tehran, where he has been teaching since 2012. He holds
a PhD in control and process modeling from the University of Technology of Malaysia. He has more than 15 yr of experience in reaction engineering, process modeling and adsorption processes. He has published more than 120 papers.


Comments