
Automated process for cooldown of main cryogenic heat exchanger
F. CHEN, M. OKASINSKI and T. SABRAM, Air Products and Chemicals Inc.,
Allentown, Pennsylvania
No matter how reliable an LNG plant is, situations will arise that require restart from a shutdown condition. These situations include initial plant startup after completion of construction, and restart after scheduled compressor or driver maintenance.
LNG plant startup and restart involve several sequential steps. The feed gas receiving, compression (if applicable) and pretreatment systems are the first units to be commissioned. This commissioning order ensures that dry, clean feed gas is available for liquefaction and for refrigerant makeup. Depending on the specific liquefaction process used, precooling systems (such as a propane refrigeration loop) must also be functioning properly to deliver feed gas and mixed refrigerant (MR) at precooling temperature to the main cryogenic heat exchanger (MCHE). This delivery is followed by cooling of the MCHE, using the MR system to establish a proper temperature profile. From this point on, the fully liquefied and subcooled natural gas (i.e., on-spec LNG) stream from the cold end of the MCHE can be sent to storage, and LNG production can be ramped up.
When cooling down an MCHE, the warm-end temperature must be maintained above the refrigerant compressor’s minimum suction temperature. At the same time, its cold end must be cooled to approximately –160°C (–256°F). During this process, the operator must monitor a number of different process variables and make necessary adjustments. A general requirement for cooldown operation is the stable and controlled supply of refrigeration in a manner that cools the MCHE within allowable cooldown rate guidelines.
 |
|
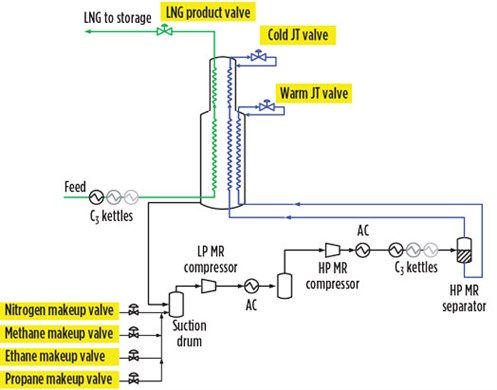
FIG. 1. Simple process flow diagram of a typical C3-MR process. |
Traditionally, MCHE cooldown is a primarily manual operation. Before cooling down, the MR compressor is started and each stage runs in full recycle, with the tube and shell circuits in the MCHE equalized in pressure to the compressor. For a typical propane precooled MR process (or C3-MR, as shown in Fig. 1), there are three process control valves and four refrigerant makeup valves that can be manipulated by the operator during MCHE cooldown:
- Cold Joule-Thomson (JT) valve
- Warm JT valve
- LNG product valve
- Nitrogen (N2) makeup valve
- Methane (C1) makeup valve
- Ethane or ethylene (C2) makeup valve
- Propane (C3) makeup valve.
The cold JT and warm JT valves set the refrigerant flowrate and control the refrigeration duty into the cold and warm sections of the MCHE, respectively. The LNG product valve sets the heat load in the MCHE by varying the feed gas flowrate. Each of the refrigerant components is added to the MR to provide a specific function:
- N2 provides the subcooling capacity and maintains the cooling driving force at the cold end.
- C1 controls vapor inventory in the shell side of the MCHE and governs the compressor suction pressure.
- C2 and C3 are heavier components that impact the circulating MR molecular weight and heat transfer characteristics inside the MCHE.
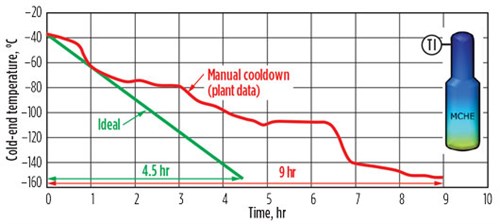
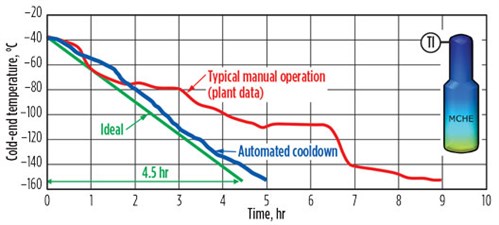
During a cooldown process, the cold-end temperature of the MCHE indicates how well the cooldown operation is performed. The red curve in Fig. 2 shows the cold-end temperature history of an MCHE in an operating LNG plant that went through a manual cooldown operation. In this example, it took about 9 hr to bring the MCHE to the final operating temperature with the cooldown operation. Several sections on the manual cooldown curve show the cold-end temperature dropping very quickly, and other sections show a slower decrease.
 |
|
FIG. 2. Example of a manual cooldown. |
Ideally, if the MCHE is cooled sufficiently quickly while still meeting all cooldown requirements, its cold-end temperature would follow the straight green line in Fig. 2. In this case, the cooldown process would take only 4.5 hr, which would both reduce undesired cold-end flaring and help the plant achieve full production more quickly. Comparing the two lines, it is clear that room exists to improve the cooldown operation by making it faster, smoother and more consistent.
MCHE cooldown scenarios. Different cooldown scenarios may be observed depending on the initial condition of the system, including the initial temperature profile of the MCHE, the MR inventory in the system, the initial suction pressure and the MR separator liquid level. Table 1 lists common MCHE cooldown scenarios for a typical C3-MR process.
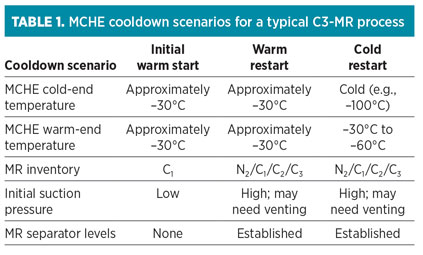 |
Initial warm start. This type of startup is typically carried out when the plant is ready for its first startup after construction, or when a plant has just undergone a lengthy maintenance outage. In this scenario, the MCHE initially has a uniform temperature profile throughout (approximately –30°C, or precooling temperature). The MR inventory is primarily C1, with low concentrations of N2, C2 and C3.
Warm restart. This type of restart is usually performed after the plant experiences downtime. The entire MCHE is warmed up from its normal operating temperature. The MCHE may have a uniform temperature that is similar to the precooling temperature. However, the MR inventory contains all of the MR components, and the MR separator liquid level is already established.
Cold restart. A cold restart is usually required when issues that halt LNG production are resolved in a few hours. This type of restart may occur more often than initial warm start or warm restart. The cold-end temperature can be quite cold, but not as cold as suitable for normal operation due to the slight warmup during the downtime.
Automated MCHE cooldown. As previously discussed, an automated MCHE cooldown operation should maintain a smooth process with an optimal cooldown rate. Cold-end flaring should be minimized by cooling quickly and consistently within operating guidelines. It should be applicable to all cooldown scenarios, regardless of the initial condition of the MCHE.
Automating MCHE cooldown operation can bring several benefits to plant operators:
- Consistent and standardized cooldown method
- Smoother cooldown operation for startup
- Faster cooldown rate
- Reduced flaring during cooldown
- Increased plant availability
- Customization for various liquefaction processes.
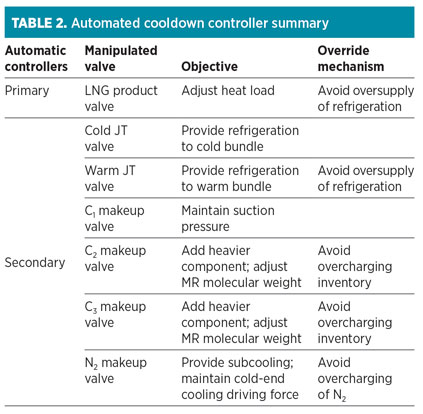
To automate the cooldown operation, it is necessary to configure a set of controller loops that link manipulated variables (e.g., valve positions) with controlled variables (e.g., cooldown rate) in the system. Each individual controller can be operated manually or automatically. The overall control program can be set to different automation levels based on operator familiarity and objectives, with a goal of minimizing the need for operator intervention. The parameters for the controllers must be verified using rigorous dynamic simulation models and fine-tuned in the field.
As an example, an automated cooldown control program can be established with two sets of PID-based controllers: a primary controller and a secondary controller. The primary controller works on the principle of feed gas response. Under normal MCHE operating conditions, the heat load and cooling duty are always balanced. However, during the cooldown process, the cooling duty must be higher than the heat load to cool the metal of the MCHE. It is most efficient to maintain just enough cooling duty to cool the MCHE at the desired rate. The amount of refrigeration increases during the cooldown process and is dependent on the MR composition, flowrate and pressure profile. The primary controller manipulates the feed gas flowrate to effectively balance the heat load and the refrigeration, thereby controlling the amount of cooling duty and maintaining a smooth MCHE cooldown process.
The secondary controller manipulates the other valves with the goal of increasing the cooling duty in a continuous and gradual manner. To do so, it automatically moves the JT valves to adjust the MR flowrates, and adds MR components through the makeup valves to set the compressor suction pressure and MR composition. In this manner, changes in MR makeup, compressor operating point or MR flowrates are made smoothly and consistently.
The automated cooldown program should also include controller override mechanisms to ensure that the cooldown operation stays on its desired course. For example, in addition to monitoring the rate of change in the cold-end temperature, the primary cooldown controller may also monitor the warm-end temperature difference (WEΔT) of the cold bundle. If the WEΔT begins to increase, then an override mechanism rebalances the heat and cooling loads in the cold bundle.
By working together, the primary controller, the secondary controller and their associated override mechanisms (listed in Table 2) provide the right amount of refrigeration to cool the MCHE smoothly and at the desired rate.
 |
Dynamic simulation. Rigorous dynamic simulation was performed to demonstrate the effectiveness of the automated cooldown program for various cooldown scenarios. In simulating the automated MCHE cooldown process, a desired cooldown rate is selected for the primary controller, while refrigeration ramping and override parameters are selected for the secondary controller. This process replicates how operators set the automated cooldown program in a real LNG plant.
The entire course of the automated cooldown process was simulated, and the resulting MCHE internal temperature profiles and cooldown rate were used to evaluate the performance of the automated cooldown process.
 |
|
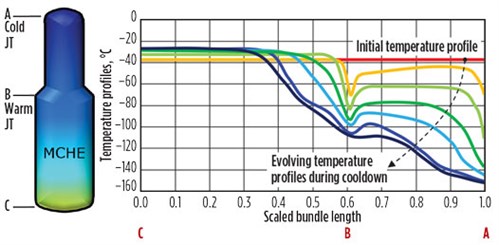
FIG. 3. MCHE internal temperature profiles for an initial warm start. |
Fig. 3 shows how the MCHE internal temperature profile evolves during the automated cooldown process for the initial warm start scenario described in Table 1. Before the cooldown, the MCHE has a uniform temperature profile of –36°C. As the automated cooldown begins, temperatures at Point A and Point B (corresponding to MR entrance into the MCHE from the cold JT and warm JT valves) decrease the most, since the two JT valves provide the cooling driving force to the corresponding bundles. The cooling continues until the desired temperature profile is established.
At the end of the automated cooldown process, the warm end remains at the precooling temperature, and the temperature inside the MCHE decreases monotonically from the warm end to the cold end, with the cold end reaching approximately –155°C. From this point on, the automated cooldown process is complete.
 |
|
FIG. 4. Comparison of automated and manual cooldown for an initial warm start. |
With the automated cooldown program (solid blue curve in Fig. 4), a faster and smoother cooldown operation was achieved as compared to the typical manual operation. The MCHE startup time is reduced by approximately 4 hr, which effectively decreases cold-end flaring of off-spec LNG and allows on-spec LNG to be sent to storage sooner. Table 3 compares the key metrics of the different cooldown operations for typical cooldown scenarios.
Recommendations. MCHE cooldown operation can be automated by configuring PID-based cooldown controllers in an existing plant’s DCS system. The effectiveness and benefits of the automated process were evaluated using rigorous dynamic simulation for several liquefaction processes and various cooldown scenarios.
Dynamic simulation results show that the automated cooldown process more closely approaches the ideal cooldown rate in a controlled manner. The automated process also provides a consistent and more standardized MCHE cooldown method, which reduces flaring and greatly simplifies plant startup. It brings the LNG plant onstream faster to achieve higher annual LNG production. GP
 |
Fei Chen is a Lead Research Engineer at Air Products and Chemicals. His responsibilities include process engineering, process safety, plant startup and troubleshooting, and LNG research and development. He received BS and MS degrees in chemical engineering from Tsinghua University in Beijing, China, and a PhD in chemical engineering from the Massachusetts Institute of Technology in Cambridge, Massachusetts.
 |
Matthew Okasinski is a Senior Process Engineer at Air Products and Chemicals. He has 15 yr of experience at Air Products and has been executing dynamic simulation projects in the LNG group since 2002. These simulations have spanned the company’s LNG process technologies, from C3MR and AP-X to AP-SMR and, most recently, AP-N. He received his PhD degree in chemical engineering from the University of Massachusetts–Amherst in 1998.
Ted Sabram is an LNG Lead Startup Engineer at Air Products and Chemicals, and has been with Air Products for his entire career. He has participated in a number of hazardous operations (HAZOP) and piping and instrumentation diagram (P&ID) development for projects, including floating, baseload C3MR, DMR, AP-N, and peakshaving LNG facilities. Mr. Sabram received his BS degree in chemical engineering from Bucknell University in Lewisburg, Pennsylvania, and his MS degree in chemical engineering from Villanova University in Radnor, Pennsylvania.


Comments