
Use analytical tools to investigate LNG molecular sieve underperformance
R. Herold, Shell Global Solutions International, Amsterdam, The Netherlands
In an LNG plant, natural gas from the wellhead must be treated before liquefaction can take place. This treatment happens in dedicated units where contaminants like water, mercury and sour components are removed. These treating facilities are an essential part of LNG plants, helping ensure reliable LNG production.
Generally, literature places emphasis on the design of future LNG plants, while the operational performance of existing facilities is infrequently discussed. When operational aspects are discussed, the focus is mainly on the liquefaction unit, as this unit consumes most of the energy in the plant.1, 2 However, sufficient and structured operational attention to treating facilities is an essential aspect of ensuring LNG plant performance. A case study of molecular sieve deactivation shows that careful analysis is needed to determine and address the cause of operational problems at the dehydration unit.
LNG process scheme. In a typical LNG plant, a split is made between warm and cold units, as these units can be independently located and operated. The cold units are typically operated at cryogenic conditions. In the treating facilities, front-end processing of the raw natural gas occurs to meet the strict feed gas specifications for liquefaction. The order of connection between the different units is determined by the feed gas requirements and the technology selected for each unit.
The feed gas from upstream typically arrives in a slug catcher before the gas is routed, via a knockout vessel, to the first gas treating unit, the acid gas removal unit (AGRU). To ensure problem-free operation of the AGRU, it is essential to have proper liquid knockout and to prevent carryover of liquid hydrocarbons to the AGRU.3 In the AGRU, the CO2 content is reduced to the LNG specification, usually by an amine-based solvent. The CO2 is removed from the gas by contacting with the circulating solvent in a high-pressure absorber. The solvent is then regenerated by stripping out the CO2, using steam at low pressure.
After contacting with the solvent, the treated natural gas is water-saturated. Before liquefaction of the gas can take place, the water content must be reduced below 0.1 ppmv to prevent freezeout in the cryogenic process units.
Deep removal of water is done by molecular sieve adsorbents in the dehydration unit (DHU). Compared with other adsorbents and water-removal technologies, molecular sieves have a high water capacity at low partial water pressures, which ensures that the tight water specification can be met.
Generally, LNG plant designs require that the DHU inventory be changed out once every four years. The changeout of the molecular sieve is usually aligned with other plant maintenance, such that a dedicated shutdown is not required and the molecular sieve changeout does not determine plant availability. Mercury-free feed gas is required to prevent mercury-induced corrosion of the main cryogenic heat exchanger (MCHE), which is made of aluminum. Mercury is removed by a non-regenerable adsorbent.
In contrast with solvent-based systems as applied in the AGRU, adsorbents used in the DHU and mercury-removal unit (MRU) are more unforgiving to process upsets. The DHU inventory cannot be changed out without affecting LNG production capacity.
To ensure that maintenance planning is not endangered, molecular sieve capacity test runs are executed on a regular basis, whereby a check is made to see if the deactivation pattern of the molecular sieve does not exceed the predicted pattern. In this article, a case is discussed in which test run results suggested that deactivation of the molecular sieves was indeed progressing faster than expected. However, a detailed analysis shows a more complicated picture.
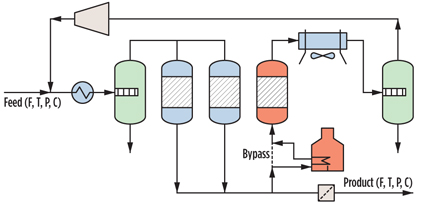
Molecular sieve dehydration unit. Water removal by adsorbents is a batch process using multiple beds, although the overall DHU is operated in a continuous manner. For a 5-MMtpy LNG train, typically, three beds filled with molecular sieve are installed. Two of the beds are simultaneously in adsorption mode, while the third bed is in regeneration mode. The water-removal capacity of the adsorbent decreases over time due to the number of the high-temperature regenerations to which it was exposed.
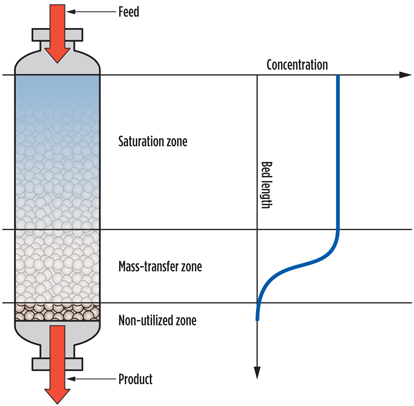
During an adsorption period, the beds adsorb water and are subsequently regenerated using a heated stream of treated gas. The increase in temperature during regeneration is one of the factors that causes water to desorb from the molecular sieve, and the process is called temperature-swing adsorption (TSA). Although TSA is a discontinuous process, the overall DHU behaves like a continuous process because one or more vessels are in adsorption mode while another vessel(s) is in regeneration mode. A sketch of a molecular sieve DHU is shown in Fig. 1.
 |
|
Fig. 1. Sketch of a typical DHU. |
The objective of regeneration is to strip off the water and any co-adsorbed impurities from the bed by passing hot gas, and then cold gas, through the bed. Water stripped off by the hot gas is condensed and disposed. The hot regeneration serves two important purposes:
- Provide heat for desorption and act as carrier gas to carry away the desorbed impurities, thereby enabling regeneration
- Optimize the performance of the DHU (which requires a detailed understanding of its operation).
During the adsorption period, the amount of water that can be adsorbed on the molecular sieve is dictated by both the capacity that can be reached in the limit of reaching equilibrium, and the capacity that results from the competition between adsorption kinetics and the flow of gas past a molecular sieve pellet.4, 5
At LNG plants, the DHU is usually operated with a fixed-cycle time. This implies that one dryer bed goes from adsorption into regeneration mode after a fixed operating time. The cycle time is determined by the minimum regeneration time and based on end-of-run (EOR) operating conditions. To account for deactivation, the uptake capacity of a molecular sieve at start-of-run (SOR) conditions could be twice as large as the uptake capacity of a molecular sieve at EOR condition.
Several mechanisms contribute to molecular sieve deactivation.6–11 The most prominent ones are caking and coking. Consequently, when confronted with a DHU unit that is operating below its expected performance, there is a tendency to assign this occurrence to the presence of caking and/or coking.
During regeneration of the water-saturated molecular sieve, hot, dry gas is passed upward through the molecular sieve bed, and water is desorbed. Subsequently, water that was desorbed from the bottom portion of the bed would be carried to the top portion, which would not yet have been heated by the regeneration gas. Since the top portion of the bed would still be cold and saturated with water, the water from the bottom portion of the bed could condense to form liquid water. The formation of liquid water in the bed can cause the clay binder of the molecular sieve to dissolve, subsequently forming cake during the regeneration step.
Caking due to liquid water formation during regeneration can be avoided by using a well-designed heating profile during the regeneration cycle. If the temperature of the regeneration gas entering the bed is slowly increased, the top portion of the bed can be preheated before much water desorbs from the bottom portion of the bed. Preheating of the top portion of the bed prevents the condensation of liquid water when the water from the bottom portion of the bed is finally desorbed. If a non-ideal temperature profile is used during regeneration, then degradation of the molecular sieve might still occur without the formation of a large solid cake.
The tendency for coke to form on the molecular sieve depends heavily on the feed composition. When there are heavy components in the feed, they can adsorb in the pores of the clay binder. During regeneration at high temperatures, the heavy components adsorbed on the molecular sieve can subsequently decompose, leaving carbonaceous deposits (coke). It is possible for coke deposits to block not only active sites, but also micropores. In such a case, many moles of active sites can be blocked by a single mole of coke deposit.
It is also possible for coke to partially block macropores of the clay binder in which the zeolite crystals are contained. In this case, the rate of water uptake on the molecular sieve would be reduced. This would manifest itself in operation in a longer mass-transfer zone, because it is in this zone where the kinetics of water adsorption compete with the rate at which water is carried past particles by the flow.
Through the blocking of micropores and macropores, the dynamic capacity of the dehydration unit is reduced twofold: first, by the direct blocking of sites by coke; and, second, by the lengthening of the mass-transfer zone, which causes water to break through at the end of the bed sooner than designed.
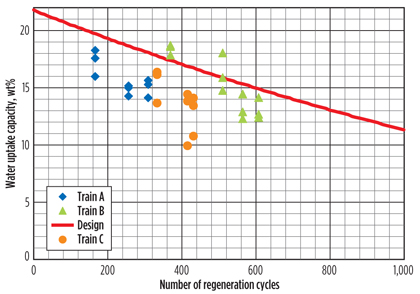
DHU test runs. DHU capacity test runs, which provide information on the amount of water that can be adsorbed by the molecular sieve, are essential for evaluating the performance of the molecular sieve and for estimating the remaining lifetime. Once the capacity has been determined from a test run, this can be plotted against the number of regeneration cycles that the bed has experienced. If the results of the test runs are plotted against the expected deactivation curve, one can evaluate whether it is possible to reach the planned changeout time. The results of several of these test runs for three trains, of a specific LNG site, are summarized in Fig. 2.
 |
|
Fig. 2. DHU test run results. |
The results shown in the graph suggest that the molecular sieve beds are deactivating much faster than expected, and, for that reason, a measurement campaign was executed to determine why the water uptake capacities of the molecular sieve beds were lower than expected.
In this article, the focus is placed on the analytical tools used and the conclusions to be drawn based on the results. In reality, many more lines of investigation would be followed—e.g., an analysis of equipment performance based on plant data (especially upstream of the DHU), an analysis of the regeneration profiles of the DHU, a historical feed analysis, etc. From an analytical perspective, two main investigation routes were followed:
- Analysis of condensates produced upstream of the DHU and in the DHU regeneration loop
- Analysis of spent molecular sieve samples.
It should be noted that attempts were made to analyze the feed gas to the DHU. However, the combination of sampling and offline analysis made this methodology too unreliable for trace component analysis.
Condensate analysis. In this case, the condensate analysis was executed on the condensate produced by the gas/liquid (G/L) separator upstream of the DHU, as well as the G/L separator that is incorporated in the regeneration gas loop of the DHU. Typically, these analyses are conducted by the plant laboratory (as per ASTM standards D5134-98 and D667-10) and reported as shown in Table 1.
The analysis results describe samples of the hydrocarbon layer formed in the G/L separator incorporated in the regeneration loop of the DHU. As can be seen in Table 1, most of the condensate samples contain a relatively large amount of higher hydrocarbons, as well as a relatively large amount of unknowns, which is an unusual result. Sample No. 5 is included as a reference and is an analysis of a similar sample taken in the past. As shown, this sample does not contain a large amount of unknowns and C10+ species.
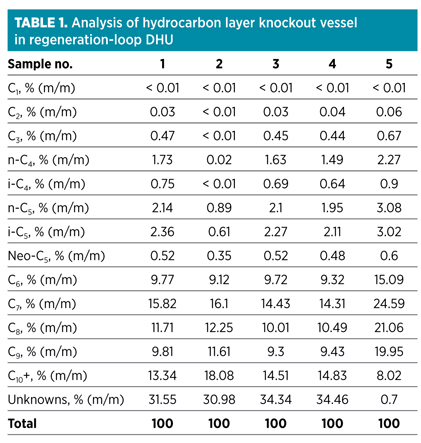
When presented with unusual results, it is recommended to study the data in more detail—i.e., examining the original chromatograms. In Fig. 3, an overlay of two samples is shown, one with a small amount of unknowns and one with a large amount of unknowns. As can be seen, the chromatogram of the sample with the large amount of unknowns (red line) shows that there is a relatively large amount of heavy hydrocarbons with a high boiling point.
 |
|
Fig. 3. Overlay of chromatograms of condensate analysis. |
This heavy tail is composed of components with a high boiling point, up to 250°C. Identifiable components were n-paraffin and isoparaffin, aromatics [benzene, toluene and xylene (BTX)], naphthenes and others. Typical examples are n-tetradecane (C14H30; boiling point of 252°C–254°C); 1,2,3,4,5-pentamethylbenzene; 1-methylnaphthalene; 2,3-dihydroindene; t-decahydronaphthalene; 5-methylindane and tetralin.
The condensate analysis suggests that heavy hydrocarbons are deposited on the molecular sieve. In that respect, it should be noted that boiling points are pressure-dependent and that the boiling point of n-tetradecane at 60 bara was calculated to be 419°C—well above the maximum temperature that can be reached during regeneration (320°C).
Deposition of such molecules in the condensate can be explained by the vapor pressure of these components; i.e., a part of the fraction will dissolve in the gas phase, while another part will stay on the sieve as a liquid, as was confirmed by calculating thermodynamic phase equilibria. This condensate analysis suggests that heavy hydrocarbons deposited on the molecular sieves during the adsorption step are not completely removed during regeneration. Analysis of condensate samples from G/L separators located upstream of the DHU showed similar results.
Additional techniques (2D gas chromatography, or GC×GC,i and ASTM D6730 PIONA analysis) were used to analyze the selected condensate samples. In general, similar results were found—i.e., the presence of n-paraffins, isoparaffins, naphthenes and aromatics. Note: Detailed hydrocarbon analysis (DHA) does not detect hydrocarbons beyond C9. DHA can identify methanol, ethanol, t-butanol, methyl tertiary butyl ether (MTBE), ethyl tertiary butyl ether (ETBE) and tertiary amyl methyl ether (TAME), but these components were not detected in the samples. Olefins were also not found in the samples.
GC×GC analysis provides a more detailed breakdown of the various components that can be found in condensate samples—i.e., paraffins, methyl-branched paraffins, ethyl-/dimethyl-branched paraffins, higher-branched paraffins, naphthenics, dinaphthenics, mono-aromatics, naphthenic-monoaromatics, diaromatics, naphthenic-diaromatics and triaromatics can be identified and quantified up to a carbon number of 30. Naphthenic triaromatics were not found in the samples analyzed. The highest carbon number found for paraffinics was 20. Monoaromatics, naphthenic-monoaromatics and diaromatics with a carbon number of up to 30 were also found in the samples.
Spent adsorbent analysis. Spent molecular sieve samples were analyzed using a variety of techniques. Results were compared with reference samples—i.e., molecular sieve samples extracted from the beds several years earlier.
As the condensate analysis showed, with the presence of heavy hydrocarbons, one of the possible explanations for faster-than-expected deactivation of the molecular sieve samples is coking. If coking is the main deactivation mechanism, then a significant increase in carbon content would be expected. Therefore, samples were analyzed using flash combustion.ii The results are presented in Table 2.
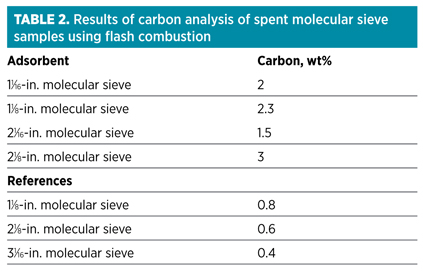
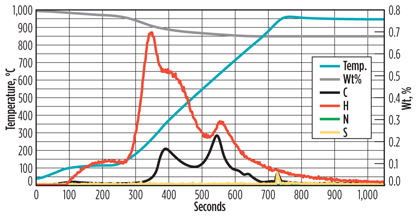
Although the results show an increase in carbon content, the values are not exceptionally high; a slight increase in carbon content is expected due to the presence of heavy hydrocarbons. The advantage of using flash combustion for molecular sieve analysis is that it is an accurate and sensitive technique. Unfortunately, the results do not contain information that would make it possible to distinguish between coke formed on the molecular sieve and hydrocarbons deposited on the molecular sieve. Pyrolysis combustion mass spectrometric elemental (PCMEiii) analysis is a technique better suited for making this distinction. An example of a PCME analysis is shown in Fig. 4.
 |
|
Fig. 4. Example of a PCME analysis of a molecular sieve. |
When examining the graph in more detail, especially when correlating the C, H and S lines with the blue temperature line, a few observations can be made. The sample is dried at around 100°C, as indicated by the increase in hydrogen content (moisture phase). When increasing the temperature further, more water is initially driven from the sample, although the slight increase in carbon content indicates that lighter hydrocarbons, and possibly some CO2, are desorbing (pyrolysis phase).
At temperatures of approximately 300°C and 600°C, hydrogen and carbon peaks are observed, indicating that hydrocarbons are desorbing. The peak at 600°C also contains a relatively long tail. It is speculated that the heavy hydrocarbons included in this peak have such a high boiling point that these components are not removed, or only partially removed, from the molecular sieve during regeneration.
At around 800°C, oxygen is added to the system (combustion phase). A small peak of carbon and sulfur is observed. As these components can only be removed from the molecular sieve by burning them, it can be concluded that these are very tightly bound to the molecular sieve and, therefore, represent coke formation.
The PCME results show that only a relatively small amount of coke is present on the molecular sieve samples. The majority of the carbon is present in the form of heavy hydrocarbons. Note: Analyzing some molecular sieve samples was complicated by the continuous leaching of hydrocarbons prior to heating, even at lower temperatures, which resulted in shifting baselines.
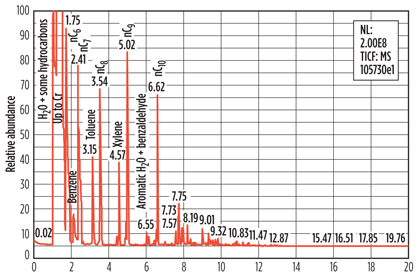
Although PCME analysis already provides valuable additional information, it cannot give information that can be used to identify the adsorbed hydrocarbons in more detail. To achieve this, the samples were analyzed using Pyrolysis GC-MS,iv a technique not previously used for the analysis of spent molecular sieve samples. An example of a Pyrolysis GC-MS analysis is shown in Fig. 5.
 |
|
Fig. 5. Example of a pyrolysis GC-MS analysis of a spent molecular sieve sample. |
The Pyrolysis GC-MS results confirmed the presence of such heavy hydrocarbons as those found in the regeneration gas condensate on the molecular sieve. BTX and paraffins up to n-C12 were identified. Unexpectedly, species like pyrazine, pyrrole, methyl-pyrrole and substituted phenols were also identified.
Paraffinic and aromatic components are expected to be found on the spent molecular sieve, although the presence of pyrrolic compounds and oxygenates is unexpected. There is a low probability that the pyrrolic compounds are decomposition products of the amine used to remove the CO2; only saturated decomposition products are formed. Therefore, it can be speculated that these components are decomposition products of surface active species (e.g., corrosion inhibitors) that are injected upstream.
A more general observation is that, when examining the pyrolysis GC-MS results, it appears as if there are less contaminants and heavy hydrocarbons on 1⁄8-in. molecular sieve samples than on 1⁄16-in. molecular sieve samples; i.e., the 1⁄8-in. molecular sieve located in the top of the bed is somewhat cleaner. As the top part of the bed will be fully saturated with water, this observation suggests that exposure to water will have a cleaning effect, likely by displacing these contaminants and heavy hydrocarbons.
Mercury intrusion porosimetry. Another methodology used when investigating the possibility of coking—mercury intrusion porosimetry (MIP)—examines whether significant changes in pore distribution and surface area occurred. This method is used for the determination of pore volume and pore size distribution for pores with a pore entrance diameter of between 3.5 µm and 400 µm. Macropores are defined as having a pore diameter greater than 60 µm, while mesopores have a pore diameter between 1 µm and 60 µm. Zeolite pores (0.4 Nm for a 4A sieve) are too small to be determined by this technique. For molecular sieves, this means that most of the information obtained would correlate to the structure of the clay binder. The results of the analysis of selected samples are shown in Table 3.
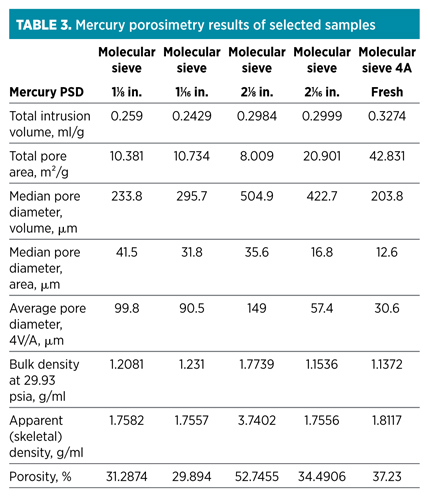
The results indicate that smaller pores are closed off in the spent molecular sieve samples, as indicated by the increase in average and median pore diameter, as well as the reduction in total pore area, when compared to a fresh molecular sieve sample.
The pore size distribution at the 4-angstrom-scale nitrogen porosimetry, or N2 PSD, was examined. However, it was not possible to analyze the samples using N2 PSD, as the samples leached hydrocarbons, even after a weekend under vacuum at 300°C, thereby making it impossible to create the required baseline for these measurements. This in itself is an important observation, as it indicates that pores are filled with liquid hydrocarbons.
Finally, one of the most important characteristics regarding molecular sieves used in a DHU is the water uptake capacity. The water uptake capacity of spent molecular sieve samples can be determined using thermo-gravimetric analysis (TGA).v Typical results are summarized in Table 4.
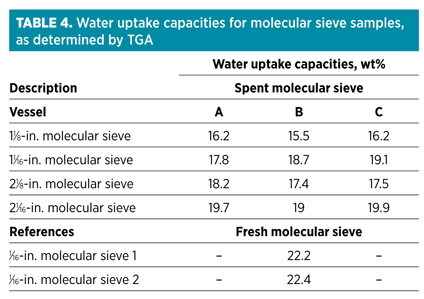
Molecular sieve samples were unloaded after approximately 750 cycles. One of the first observations was that these capacities are much higher than those observed when executing test runs. A partial explanation for that is that capacities measured using TGA are static capacities, while test run capacities are dynamic capacities. Dynamic capacities are, by definition, lower as they account for the presence of a mass transfer zone (MTZ) in the bed. In the S-shaped MTZ, only 50% of the available capacity is used. Fig. 6 shows a schematic presentation of a DHU bed in adsorption mode.
 |
|
Fig. 6. Schematic depiction of an adsorber bed in action. |
However, these capacities are much higher than one would expect, even when taking a normal deactivation pattern into account. The only conclusion to be drawn from these capacity measurements is that the water uptake capacity degradation of the molecular sieve is less severe than the test run data suggests.
Discussion. Other possible explanations for a lower-than-expected water uptake capacity, such as caking, bottom support failure, other mechanical problems (e.g., valve bypass) and channelling (where part of the bed is bypassed) are not discussed in detail here. However, typical indicators for these effects, such as extremely slow water breakthrough or an increased pressure drop over the bed, were not observed during operation. Spent molecular sieve analysis, as well as regeneration profile analysis, made the occurrence of caking very unlikely.
Furthermore, as the same phenomenon occurred in many beds simultaneously, mechanical problems were already deemed improbable in an early stage of the problem analysis.
The data collected suggests a contrast between the observed water uptake capacity of the beds and the more common deactivation mechanisms, such as caking and coking. The question is whether there is sufficient data available for postulating a hypothesis that could explain the observed underperformance of the molecular sieve beds. The main observations of interest needed to formulate such a hypothesis can be summarized as follows:
- Heavy hydrocarbons with high boiling points are deposited on the molecular sieve beds
- These components will not be removed, or they will be only partially removed, from the molecular sieve beds by regeneration
- At adsorption conditions, these heavy hydrocarbons are most probably in the liquid phase
- Data and observations suggest that the micropores of the molecular sieve are filled with liquid hydrocarbons, and, during adsorption, the macropores are likely also filled with liquid hydrocarbons
- Coking and/or caking do not appear to be the main cause for the observed underperformance.
It is probable that heavy hydrocarbons deposited on the bed will form a thin film around the molecular sieve particles, as well as fill the larger pores of the clay binder. The molecular sieve particles could be soaked with liquid hydrocarbons. Such a hydrocarbon film would likely add significantly to the mass-transfer resistance (MTR) for water molecules that must enter the molecular sieve pores, especially because such a hydrocarbon film would be apolar in nature, while water molecules are polar. If the larger pores of the molecular sieve are filled with liquid hydrocarbons, even more MTR would occur.
One consequence of an increase in MTR is an increase in the length of the MTZ, which manifests itself as a decrease in the dynamic water uptake capacity of the molecular sieve bed. A longer-than-expected MTZ, caused by the deposition of liquid hydrocarbons is, therefore, believed to be the most probable explanation for the observed underperformance of the DHU, as it fits perfectly with all the data collected. In this specific case, the best solution could be to slightly increase the temperature of the feed gas, so as to move away from the hydrocarbon dewpoint. In other cases, improving upstream separator performance could be a mitigating action.
Additionally, the use of pyrolysis GC-MS as an analytical tool for spent molecular sieve analysis has proven its value in this case as a means to identify individual components that are adsorbed on a spent molecular sieve.
Recommendations. If a DHU unit is not operating correctly with respect to its water-removal design capacity, then it does not automatically imply that the molecular sieve deactivation is more severe than expected. As shown in this case study, a change in feed composition results in the deposition of liquid hydrocarbons in and on the molecular sieve particles, which manifests itself as an increase of the MTZ, thereby reducing the effective water uptake capacity of the molecular sieve beds.
The case study in this article also demonstrates that careful selection and combination of the analysis results is needed to determine the cause of DHU underperformance. In this specific case, the deposition of liquid hydrocarbons appears to be the main reason, while, in other cases, caking and/or coking could be the main cause(s) of DHU underperformance. GP
Notes
iIn 2D gas chromatography, or GC×GC, a representative sample is introduced into a gas chromatograph equipped with a 10-m-long open tubular (capillary) column coated with a liquid phase DB1, 250-µm, 0.25-µm film. In this column, the first dimension of separation takes place based on the boiling point of the components. A modulator is used to extract small fractions of column effluent and inject these into a second, 2-m-long capillary column (VF17MS, 100-µm, 0.05-µm film), where separation takes place based on polarity and shape of the molecules. The columns are connected by a 2-m-long fused silica capillary (100 µm). Helium carrier gas transports the vaporized sample through the columns. Components are sensed, using flame ionization detectors, as they elute from the end of the columns. Each eluting component is identified by comparing its retention time to that established by analyzing reference standards or samples under identical conditions. The concentration of each component in mass% is determined by normalization of the peak areas after correction with detector response factors.
iiIn flash combustion, the carbon and sulfur fractions are measured via combustion technology. A test portion is combusted in an oxygen stream, and carbon and sulfur are subsequently analyzed using infrared detectors that are specific for the CO2 and SO2 formed in the combustion. Two different combustion furnaces are available through a high-frequency induction furnace and a resistance furnace. The high oxidation temperatures that can be achieved (up to about 1,700°C when using the induction furnace, and up to 1,550°C when using the resistance furnace) imply that even refractory sulfur-containing compounds (e.g., CaSO4) are decomposed. Prior to the analysis, CO2 and H2O present in the oxygen are removed by leading the oxygen over a trap containing sodium hydroxide (CO2 removal) and magnesium perchlorate (H2O removal).
iiiPyrolysis combustion mass spectrometric elemental (PCME) analysis enables a rapid characterization of the elemental composition of compounds volatilized during thermal treatment (100°C–1,000°C). The amounts of deposits (C, H, N and S) are determined on the samples. This information can be used to evaluate the degree of deactivation due to pore blocking by, for example, coke. PCME distinguishes between a volatile and a residual fraction of each element. Volatiles are defined as the fraction that evaporates from a sample under nitrogen flow at temperatures between 100°C and 800°C. The residuals are defined as the fraction that is burned from the sample surface at 1,000°C using oxygen. The PCME analyses are performed using a Balzers quadrupole mass spectrometer Type 511. Nitrogen is detected by using chemiluminescence, while sulfur is determined by using combustion/infrared (LECO) and X-ray fluorescence spectrometry. The information retrieved with PCME does not enable a distinct identification of the adsorbed components, although the C/H ratio can give some information.
ivPyrolysis gas chromatography-mass spectrometry (Py-GC-MS) uses a CDS 5000 series pyroprobe in series with a Thermo Trace gas chromatography-quadrupole mass spectrometry instrument. The pyroprobe was flash heated from room temperature to 750°C at a rate of 20°C/msec. The GC column was a 30-m Restek RTX-5MS column with a 0.32-mm inner diameter with 0.25-µ film thickness. The following GC oven temperature program was used: one-minute isothermal at 40°C, and then a linear ramp of 10°C/min to an end temperature of 300°C.
vThe adsorption capacity of materials is measured in a thermo-gravimetric analyzer (TGA). The TGA is basically a sensitive scale that measures the weight change of a sample during adsorption. The TGA also includes an oven to heat the sample. During an adsorption capacity measurement, a sample of molecular sieve is put on the sample pan of the TGA under a flow of dry nitrogen, and the sample pan is lowered into the oven of the TGA. In the case of 4A molecular sieves, or a guard layer used in the same vessel as 4A sieves, the sample is heated to 300°C to desorb water that had adsorbed on the sample from the relative humidity in the atmosphere. The weight of the sample is recorded during the heating step, and the heating is stopped when the weight of the sample ceases to change over time. The sample is then cooled in the stream of dry nitrogen to 25°C. The feed gas to the TGA is then switched to a stream of nitrogen containing a known amount of water (1938 Pa partial pressure), and the weight of the sample is recorded as the dynamic process of adsorption proceeds. When the sample has reached a steady-state weight, the measurement is finished. The weight gain of the sample when exposed to the stream of nitrogen containing water vapor is the adsorption capacity of the molecular sieve. Often, the adsorption capacity is expressed in terms of wt% water, or moles water per kg of adsorbent.
Literature cited
1Carlsson, A., “NLNG maximizes LNG production in supply constraints,” Oil and Gas Journal, July 5, 2010.
2Wilson, J., and G. van der Wal, “Leading the pack for efficiency and environmental performance at a baseload LNG plant,” Gastech 2008, Bangkok, Thailand.
3Raymond, A., F. Levesque and H. Lakhami, “Separations technologies to improve amine system reliability: A case study,” Laurance Reid Conference 2011, Norman, Oklahoma.
4Yang, R. T., Gas Separation by Adsorption Processes, Imperial College Press, London, UK, 1997.
5De Bruijn, J. N. H. and M. A. Huffmaster, “Maximizing molecular sieve performance in natural gas processing,” GPA Annual Convention, Dallas, Texas, 2002.
6Carlsson, A. F., R. H. M. Herold and C. J. Smit, “Adsorption and regeneration on molecular sieves,” PTQ, Q4, 2006.
7Meyer, P. B., “Hydrothermal damaging of molecular sieve and how to prevent it,” GPA Europe Conference, Paris, France, 2003.
8Terrigeol, A., “Molecular sieves in gas processing: Effects and consequences by contaminants,” Hydrocarbon Processing, January 2013.
9Bombardieri, E., “Extending mole sieve life depends on understanding how liquids form,” Oil and Gas Journal, May 19, 2008.
10Bombardieri, E., “Molecular sieve dehydration operational problems and solutions,” GPA Annual Conference, Grapevine, Texas, 2008.
11Qualls, W. R., J. Watkins and D. Radtke, “A Tale of Two Sieves,” Gastech 2011, Amsterdam, the Netherlands.
 |
Ruud Herold is a senior process engineer at Shell. He joined the company in 1986 and started working in the gas processing group in 2000, where he specializes in adsorption processes. Mr. Herold holds an MSc degree in chemical engineering from the University of Amsterdam.


Comments